Exploring Gradient Functions
What & why?
A colleague was looking for ideas about introducing e. It can seem like it comes out of nowhere and the students struggle to relate it to what they already know.
Maybe 15 years ago I was shown this activity using a package called Autograph. I don't know what happened to Autograph, but we have Geogebra now, so I've thrown together this slide to resurrect this activity, which is a little bit sticky has a little bit of aha.
This slide is for introducing e^x and where e comes from and how it helps with differentiation. I would use it after teaching the chain rule and the product rule. Students will only have seen boring examples of these two rules involving polynomials so they won't really see the point in them yet.
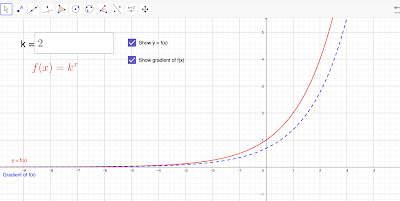
1) Plotting y=2^x and its gradient function
Ask the students to plot the graph of y = 2^x on MWBs. ["Don't rub it off. Put your boards face up on the desks."]
Teacher opens the Geogebra page.
Make sure the graphs are both hidden and k=2 before you display the page to the class. If the students see the graphs the activity will lose some impact.
Project the axes on the whiteboard. Get a volunteer to draw on the axes on the board. Ask the group if it is accurate enough and elicit improvements until you are happy with their efforts.
Click on Show y=f(x) and hopefully the red line will appear over their graph and everyone will feel good about themselves.
"Now we want to draw something called a gradient function. What is a gradient function?" [Think Pair Share?]
If they are getting close then follow up with: "How can we draw the gradient function for this function?" [Think Pair Share again maybe, or take hands-up]
Hopefully the suggestion will be to measure the gradient at different points along the curve - hopefully you have a metre rule handy and the students can take care of this for you. You can divide the class up into groups to work out different gradients. Maybe you have bossy students with leadership potential who can organise it for you.
Once you have the gradient values for, say x = 0, 1, 2, -1, -2 you know what points to plot and you can guess what the graph looks like. Students plot it - click on Show gradient of f(x) and see how close you got.
Pause here and ask students to summarise what they just did. Then ask then to comment on the graph. You are looking for something like: "it is the same shape", "the gradient is below the curve"
[At the side of the board write y=2^x and draw a quick sketch of the y=2^x and gradient function]
2) Plotting y=3^x and its gradient function
"So what will be different if k=3 - if we look at the graph of y=3^x?" Hide the gradient function for a minute
"What will be different about the red line?" Get students to guess where the graph goes on the board before changing the value of k to be 3 and see how close they were.
"And k=4?"
"And k=5?"
"And k=100?"
"Let's go back to k=3." Show the red function.
"What about the gradient function for this one? Without calculating anything, would anyone like to guess what the gradient function will look like?"
They are likely to draw the gradient function below the function as before. In fact the gradient function comes out above the function.
"What do you notice this time? How is it different to the previous example?"
[Underneath your y=2^x sketch, draw a quick sketch of the y=3^x and gradient function]


Comments
Post a Comment