Scalar Product of two vectors
A guided discovery activity for the Scalar Product
You need
- Vector cards, something like this:
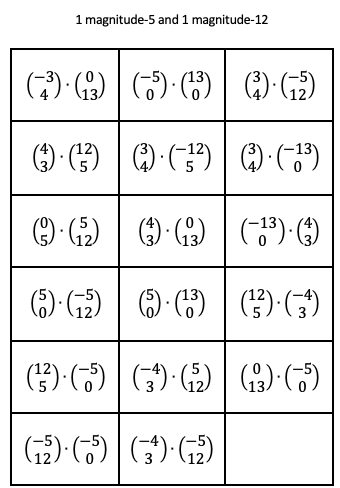
 (but better)
- Mini whiteboards or blank scrap paper to do a rough drawing.
- Protractors.
- A projector or screen to display the axes. I've prepared these - choose your favourite:
GeoGebra version (In radians by default - be careful use the degrees symbol. It shows you how to type it on the top-left. alternatively you can deal with unit conversion if you think your class can handle it.)
Desmos Version (In degrees by default - you can skip out radians.)
You can choose whichever version you like better. Personally I prefer the GeoGebra version because Desmos has strange minor gridlines.
(If you know how to fix it so there are 5 minor gridlines instead of 4 then please get in touch.)
Before you start
Procedure
1) Students (as individuals or in pairs) are given a card with two vectors. They must do three things:
a) Find both vectors on the printed axes and measure the angle between them. This is x.
b) Calculate the scalar product of the two vectors: This is y.
c) On a mini-whiteboard/scrap paper, students draw their two vectors, and write the scalar product next to it.
Ask early finishers to work out the magnitudes of their vectors and all of the other vectors on the graphs. (Should be 5 and 13 for all.) Can they draw a shape which goes through all of the red vectors and a shape which goes through the green ones? If they finish that quickly maybe they can come up with other vectors of magnitudes 5 and 13 that haven't been included and do a, b & c with them.
2) While they are busy, you should turn on your screen and project the axes. (On GeoGebra try to plot the degrees symbol.)
3) Each student or pair of students has an x and a y value, which makes a coordinate pair. Each student comes to the board, where the axes are projected and marks the position of their point on the axes with a X or a lump of blue-tac or a magnet or whatever and then returns to their seat.
4) Follow the script below, to elicit the formula. Respond to misconceptions and slow down if you need to.
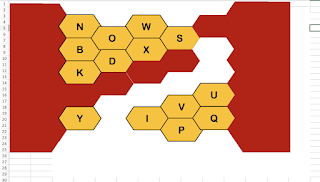
5) Make students find their scalar product that they worked out in step 1. Make them stand up with their vector diagrams and line up from largest (most positive) scalar product value to smallest (most negative) and hold up their vector pictures.
Their pictures should look something like this, all lined up:

Get them to make observations about vector pairs with positive and negative scalar products - write them on the board. Prompt if necessary.
- The bigger values happen when the vectors are pointing the same way more / when the angle is smaller.
- The negative values are when the vectors point away from each other more / the angle is larger / closer to 180 degrees.
- When two vectors are perpendicular, the scalar product is zero.
(Point out that these are all properties of cosine.)
~~~~~~~~~~~~~~~~~~~~~~~
Teacher script (Adjust as necessary)
- What shape is it? a line
- Can we find an equation for the line?
- How do we do that? we need a gradient and a point
(Work it through, take their cues and find the equation they want to find - write it down )
- We can check, look. (Type their line equation into GGB and press enter) Is that right?
- Well it works for these points, but not these ones over here, look.
- That is a straight line but it doesn't hit our data. We need a different shape... Oh Brian has an idea - yes Brian? "a sine graph"
- What, so "y = ...) y = sinx
(Type in "y = sin(x)") Is that right? No, well its the right sort of shape, isn't it? So how can we make it better? The amplitude is wrong
- Oh you're using a Physics word - good work. Please can you remind us what amplitude means? Its the height of the wave
- So this distance like this? (draw on the graph) How do we need to adjust our formula?
(Change the formula definition to"y= [Their 65]*sin(x)" )
- Oh dear, it's still not lined up... So close! What else can we try... Linda? If it is not sin, then what else could it be? cos
- Right! Cosine! Say "cosine" (Like "photo" not like "Ron")
(Change the formula definition to"y= 65*cos(x)" )
- That looks better, right? Oh who plotted this one? Ha ha. I'll just move that here... No problem
- So we have: (Write: y = 65cos (x) ). Let's remember where they came from...
y = scalar product of two vectors and
x= the angle between them measured in degrees, so...
- We can write that as: u . v = 65 cos (theta) (draw two vectors and the angle between them)
- Where does the 65 come from? Let's look at the vectors we started with... Jack and Jill - you found the magnitudes of the vectors earlier didn't you, when you finished early? 5 and 13
- So the 65 is... ? 5 times 13
- Can we make that sound a bit more mathematical? The product... The product of the 5 and 13
- In general then, the product of the mag... The product of the magnitudes of the two vectors
- Right! (Write: u . v = | u | | v | cos (theta) )
- This is the magic formula - we'll use this a lot. Feast your eyes on it for a minute. Notice, theta is the angle when the two vectors originate from the same point.
- Now remember, we found it by pattern-spotting - human brains are pretty good at that, but we don't understand it yet. What is the formula showing us? And what does it mean? And how is it useful?
(Ready for step 4)
Comments
Post a Comment